SparkFun Qwiic Environmental Combo Board
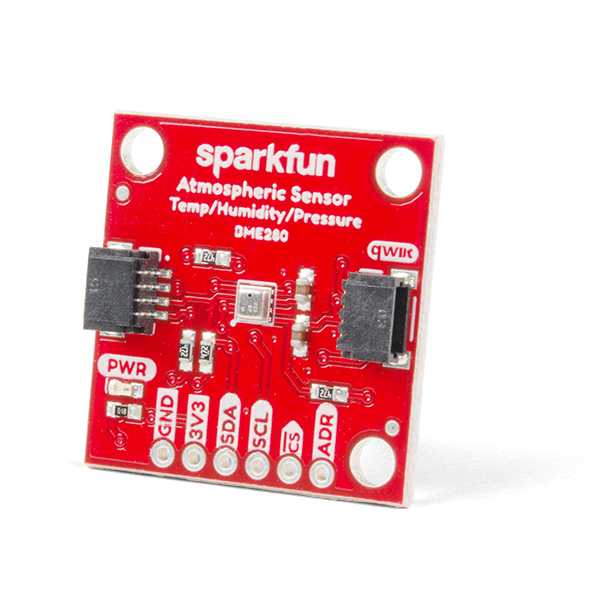
The SparkFun BME280 Atmospheric Sensor Breakout is an easy way to measure barometric pressure, humidity, and temperature readings. The BME280 Breakout has been designed to be used in indoor/outdoor navigation, weather forecasting, home automation, and even personal health and wellness monitoring.. To make it even easier to use this breakout, all communication is enacted exclusively via I2C, utilizing Qwiic system.
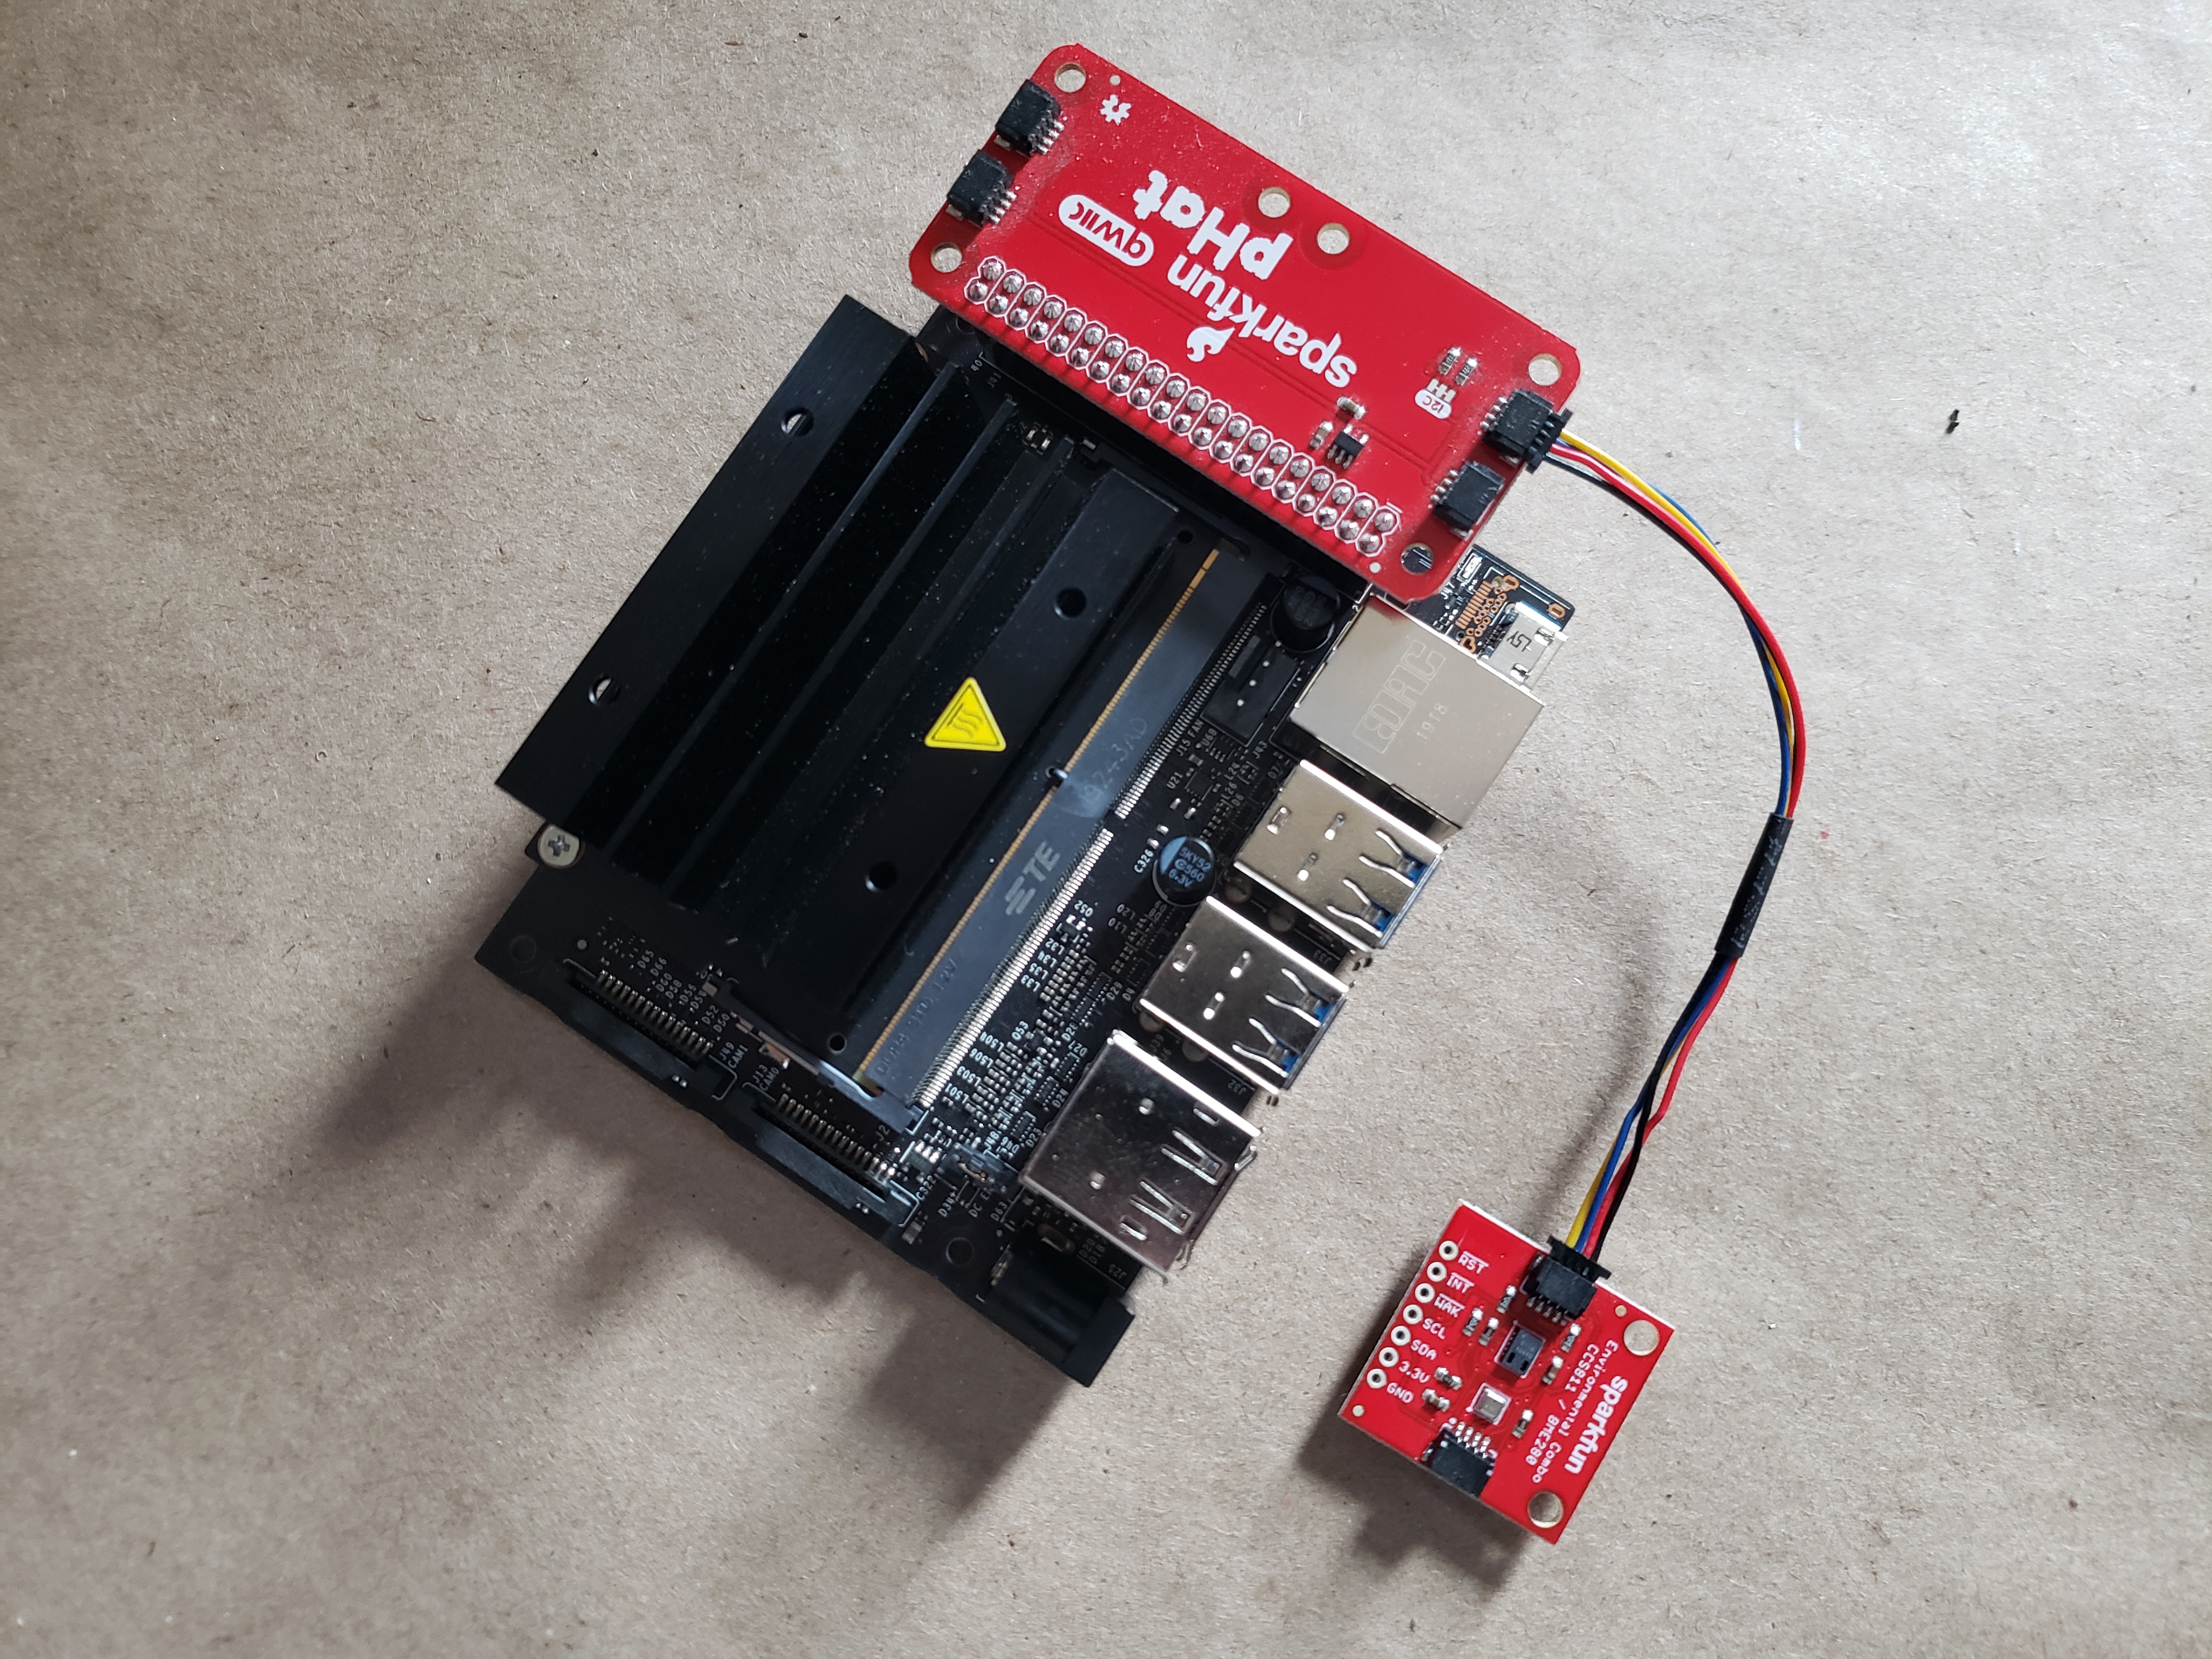
Qwiic Hookup
The Code
To use the Qwiic Environmental Combo in Python and your Nvidia Jetson Orin Nano, you first need to install the required Python libraries for it. If you haven't done so yet; no worries! You could find a quick start notebook for you here which will walk you through installing the libraries through Jupyter Notebooks Terminal window.
Once everything is installed we import the libraries into our program. Note that the Environmental Combo board is a mash-up of two sensors, so we import libraries for the BME280 (qwiic_bme280). We also include the time library
import qwiic_bme280
import time
import sys
Visualization utilities
Execute the cell below to enable live plotting.
from bokeh.io import push_notebook, show, output_notebook
from bokeh.layouts import row
from bokeh.plotting import figure
from bokeh.models import ColumnDataSource
from bokeh.models.tickers import SingleIntervalTicker

def figure_setup():
    output_notebook()

    colors = ['#1f77b4', '#ff7f0e', '#2ca02c', '#d62728']

    p1 = figure(title="Temperature (C)", x_axis_label="time", height=300, width=360)
    p2 = figure(title="Humidity", x_axis_label="time", height=300, width=360)


    source1 = ColumnDataSource(data={'time': [], 'temp': [] })
    source2 = ColumnDataSource(data={'time': [], 'Humidity': [] })


    r1 = p1.line(x='time', y='temp', line_width=2, color=colors[0], alpha=0.8, legend_label="Temp", source=source1)
    r2 = p2.line(x='time', y='Humidity', line_width=2, color=colors[1], alpha=0.8, legend_label="Humidity", source=source2)

    p1.legend.location = "top_right"
    p1.legend.click_policy="hide"

    p2.legend.location = "top_right"
    p2.legend.click_policy="hide"

    return p1, source1, p2, source2
Sensor Data Collection
In the following line; first off we instantiate librariy as their own object (my_bme). We do a quick test to make sure the sensors is connected to our system, if not it will return an error for you. Finally, if we are all good and clear we start the sensor with its .begin() methods.
For more information and a deeper dive into the Qwiic Environmental Combo board APIs Please refer to our API references at BME280.
The following code continuously reads temperature and humidity data, displays the results in real time, and stores the measurements for later use.
my_bme = qwiic_bme280.QwiicBme280()

p1, source1, p2, source2 = figure_setup()

handle = show(row(p1,p2), notebook_handle=True)

data = [['time (s)', 'temp (C)', 'humidity (%)']]


if my_bme.connected == False:
    print("The Qwiic BME280 device isn't connected to the system. Please check your connection")

else:
    start = time.time()
    my_bme.begin()

    # Once the sensors have started, inside of an infinite while loop we read the sensor data and print it out once every second.
    while True:
        try:

            time.sleep(1)

            sample_time = time.time()-start
            temp = float(my_bme.temperature_celsius)
            humidity = float(my_bme.humidity)

            data.append([sample_time, temp, humidity])

            new_data1 = {'time': [sample_time],
                     'temp': [temp] }
            source1.stream(new_data1)

            new_data2 = {'time': [sample_time],
                     'Humidity': [humidity] }
            source2.stream(new_data2)

            push_notebook(handle=handle)

        except KeyboardInterrupt:
            break
Saving the Recorded Data to a CSV File
Stop the previous cell before running this one to ensure the data collection process has ended.
The following code saves the collected time and voltage measurements into a CSV file for later analysis.
import csv

file_name = 'my_data.csv'

with open(file_name, 'w', newline='') as file:
    writer = csv.writer(file)
    writer.writerows(data)
Task 1: Sampling rate investigation
The last two cells display and save the sensor data in real time with a sampling interval of 1 second.
Modify the code to use a sampling interval of 0.1 seconds instead.
Additionally, change the output file name to avoid overwriting the previously saved file.
Task 2: Real-Time Plot Behavior
While the code is running in real time:
Breathe on the sensor.
Touch the sensor gently.
Observe:
- What happens to temperature?
- What happens to humidity?
- Which one changes faster?